---
title: "Dashboard in Flow"
url: "https://help.capitech.no/en/article/new-article-6a51a9a7-1ddc-40e1-abb5-edba59f8b296"
language: "en"
last_updated: "2026-05-08T10:49:47.178Z"
---
# Dashboard in Flow
When you log in to Flow, Dashboard is the first page you see.
The dashboard provides you with an up-to-date overview of tasks and events that may require follow-up, for example:
- approval of time registrations
- unread messages from employees
- absence applications
- employees who have not shown up for work
The information you see is filtered based on the access you have as a manager. This may, for example, be based on department, project, or other selected dimensions.
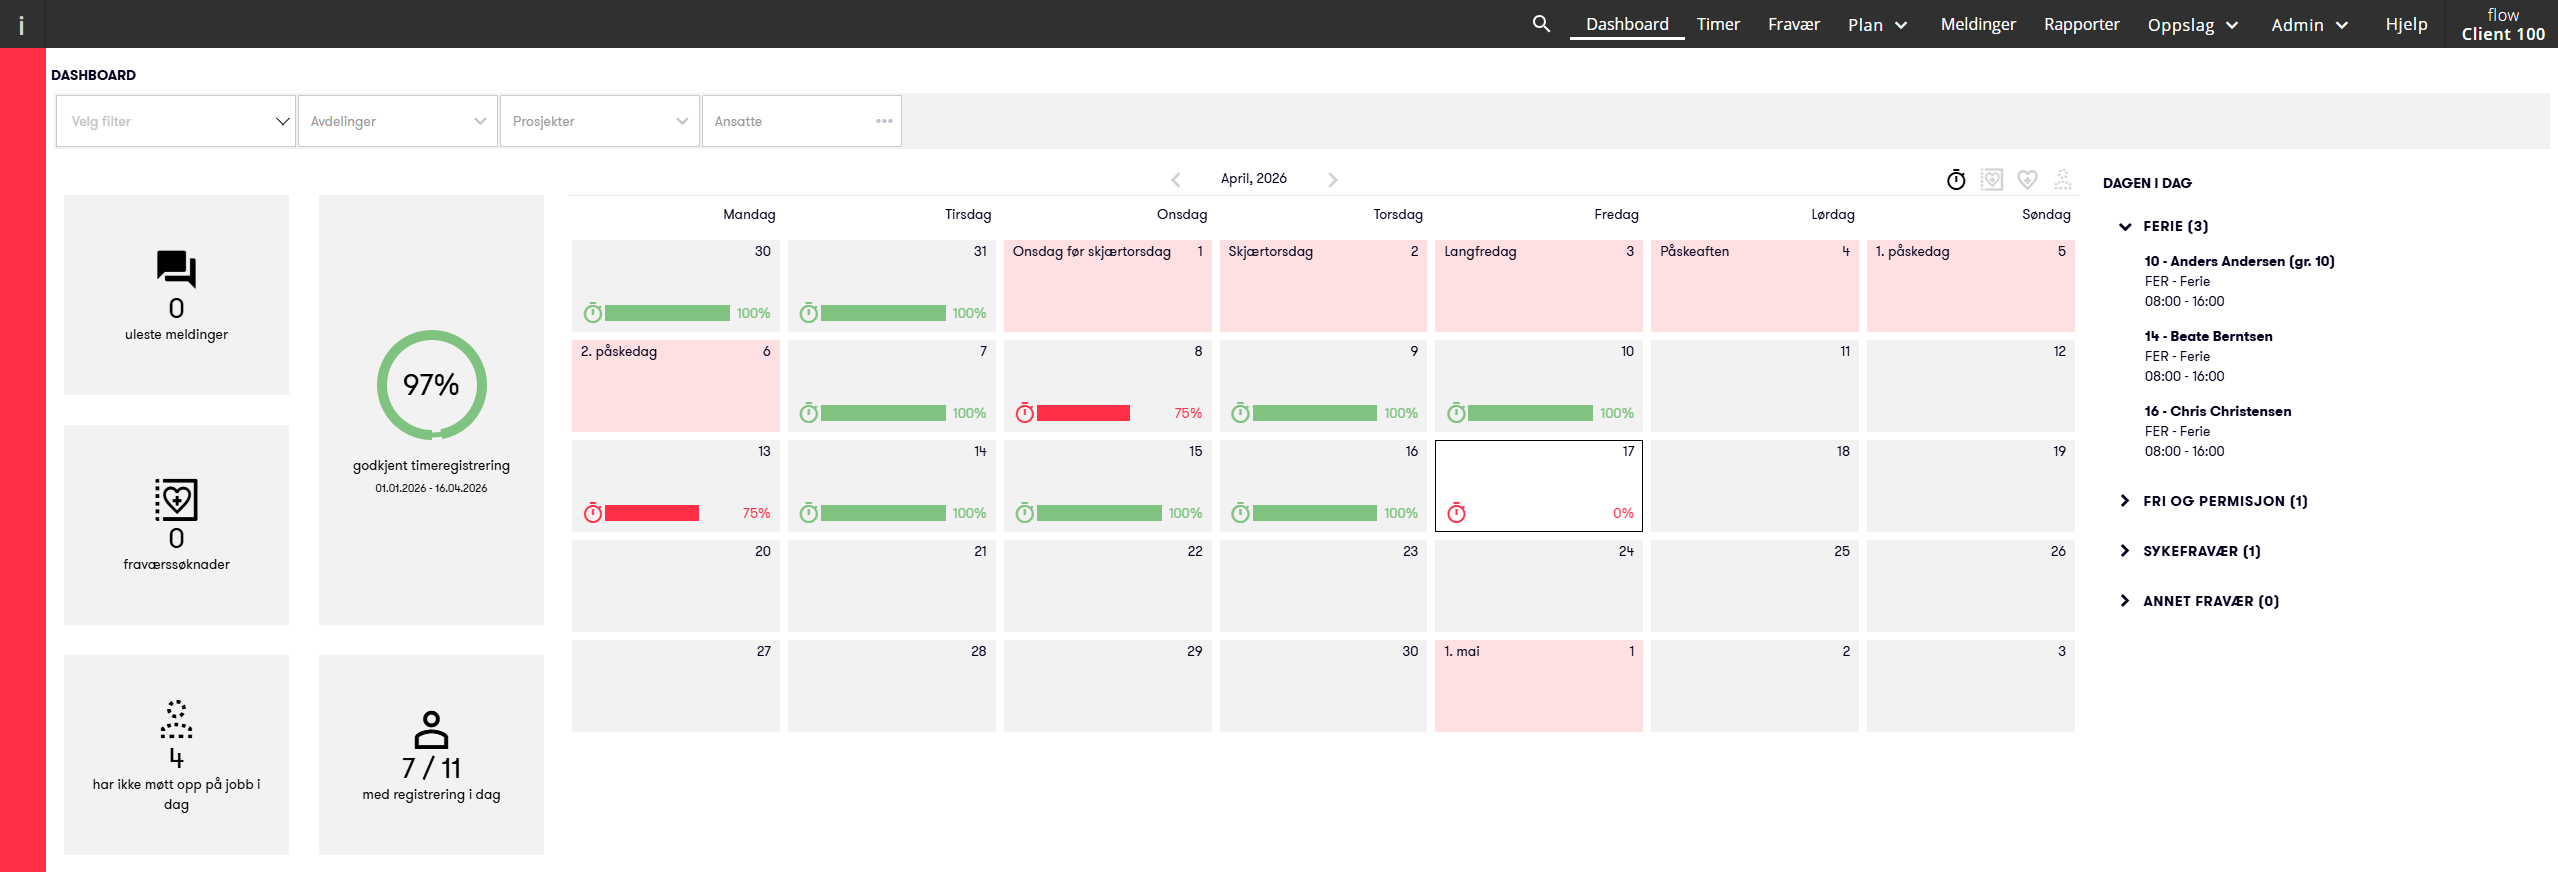
## Filter the content in Dashboard
At the top of the page, you can use filters to narrow down the view. You can filter by:
- department
- project
- employees
This makes it easier to get an overview of the employees or areas you follow up.
### Icons
The calendar on the dashboard uses icons to show important information. You can click the icons in the top-right corner above the calendar to show more or less information in the view.
| Approval rate
 | The stopwatch shows what percentage of hours has been approved per day.
Green means that all hours have been approved.
Red means that less than 100% of the hours have been approved.
Click the icon on a date to open **Hours** in the main menu. There you can see details and approve registrations. |
| --- | --- |
| Absence
 | The heart icon shows that there is approved absence on a day.
Click the icon to open **Absence** and see the details. |
| Absence Requests
 | The framed heart icon shows that there are absence applications that have not been processed.
Click the date to open **Absence**, filtered by absence applications. |
| Missing Attendance
 | The icon with the outline of a person shows that one or more employees were expected to be at work, but are missing registered hours and/or absence.
Click the icon to open **Hours**, filtered by missing attendance. |
### **Widgets**
The dashboard also contains widgets that give you a quick overview and shortcuts to other parts of the system.
#### **Approved time registrations**
Shows the percentage of hours approved 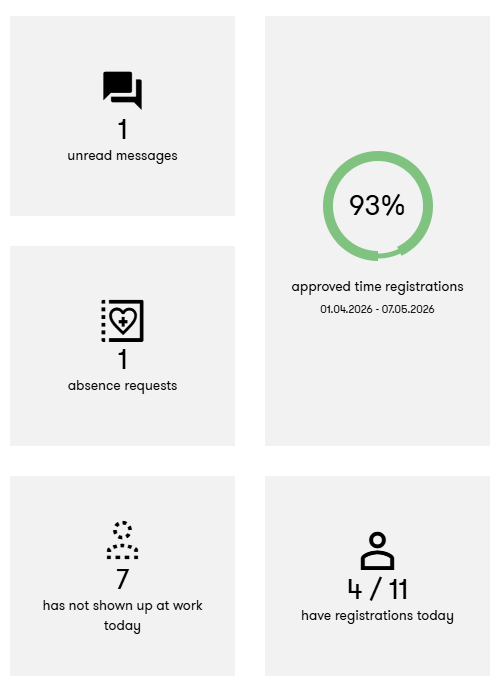since the last payroll export and up to today. Click the widget to open Hours.
#### **Messages**
Shows the number of unread messages from employees. Click the widget to open messages.
#### **Absence applications**
Shows the number of absence applications that have not been processed. Click the widget to open Absence, filtered by unprocessed applications.
#### **Not shown up**
Shows the number of employees who have not registered hours and/or absence today, but who were expected to be at work. Click the widget to open Hours, filtered by Missing attendance.
#### **With registrations today**
Shows how many have registered hours and/or absence today, compared to how many were expected to be at work. Click on the widget to open Hours with a detailed overview.
## Easy filtering by employees you manage
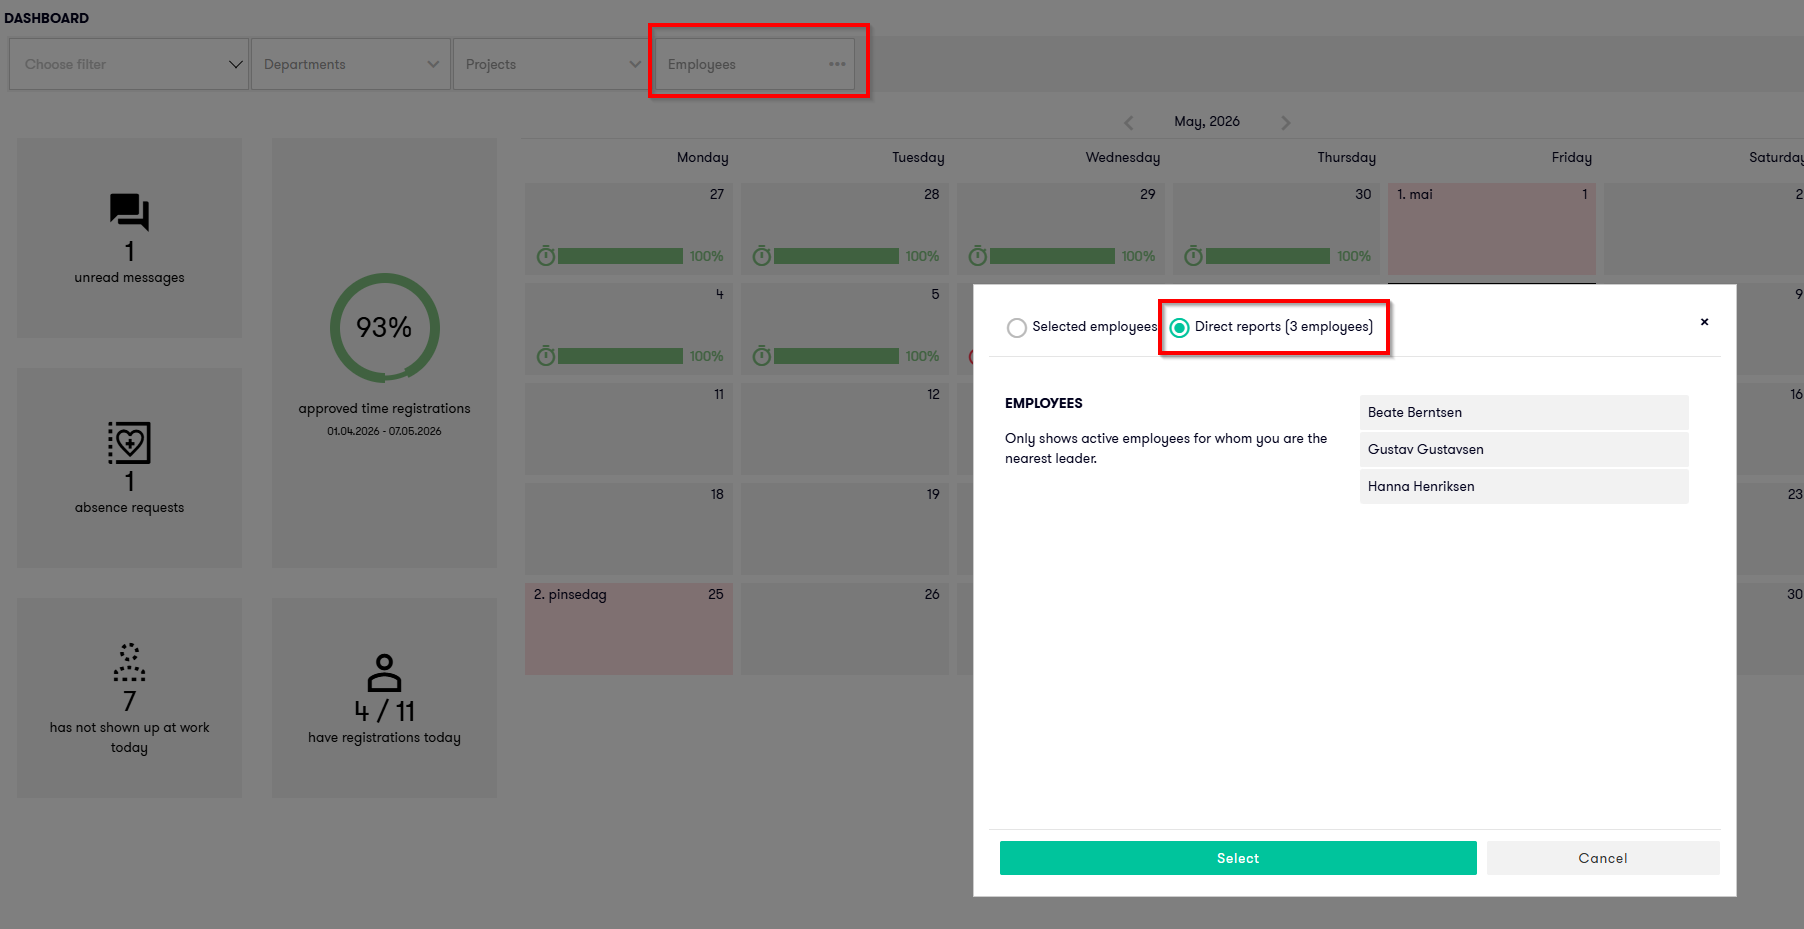
If you are set as the manager for employees in the employee register, you can easily select a predefined filter that only shows these employees.
By saving this as a filter, you can use the same view across **Dashboard**, **Hours**, **Absence**, and **Operational Plan**, and get an efficient overview of your employees.
To activate this, click the employee filter, select **Direct reports**, and save this as a filter with ypur desired name.